Patchouli boy, Sean Crichton, did absolutely fantastic at the xTerra race last weekend in Hanna Park finishing 3rd overall. The swim was won my Owen “I swam at Auburn” (sorry – don’t know his last name) and Hercules and I were sure that he started in a different wave. This guy put like 2-3 minutes on the field over 1/2 mile – really impressive.
On the bike – Sean reeled him in and was in 1st overall by the 2nd lap. Going in T2 Sean held the lead and race would be decided on the run. Sean went out fast but by the time Owen had made it out of transition the 1 minute lead was down to 30 seconds and Sean was racing for 2nd or 3rd. Sean held on for 3rd overall and a REALLY strong race – congrats!!!
I promise – this is the last of the heavy geek entries – I hope :)
I have really been fascinated by a formula that Lyndon Box turned me on to and it predicts Ironman run performance as a function of bike leg effort.
This requires that you use a power system to monitor your race performance.
If you know your FT (Functional Threshold – the power you can sustain for 1 hour) and your projected time on the course, this formula will give you a % of your FT to ride and a total TSS (Training Stress Score) in order to give you a good shot at running the whole marathon.
It will actually give you green, yellow and red ratings:
Green, your probably running the whole marathon at your desired pace.
Yellow – maybe – just maybe - if your fit – really fit – your run will be ok.
Red – probably going to be walking – say hello to the Monkeys :)
The guys who developed this used data from over 100 athletes to create the table and I have used it to predict performance and forensically to see what training and racing files looked like. I would say they nailed it.
If you want to see more from them check out Endurance Nation.
http://www.endurancenation.us/
Anyway – one of the keys to using this chart and formula effectively is to minimize the surges in your power and keep your VI (Variability Index) as low as possible.
People often refer to this as riding “cheesy”.
You use to lowest power possible to get where you want to be and by doing this wasted effort is minimized.
Why does this matter?
Imagine driving your car 100 miles and every minute or two you stomp on the gas and then let off the gas completely and coast then repeat until you get there.
Most cars have a monitor for fuel consumption and if you did this you would see that the MPG would be really low when you floored it and really high when you cruised but your average MPG would be really low.
No one would drive this way but people ride like this all the time.
Now instead – imagine you set the cruise control on 70 and then put on some Snoop and just chilled. Exactly, you would arrive sooner on the cruise control and you would use less gas which means more money for the Gin and Juice.
Point is – your body reacts the same way when you are cycling and it takes more or at least equal energy in the surging ride style BUT it results in a with slower average speed.
My test of this was totally unintentional but it completely proved the point.
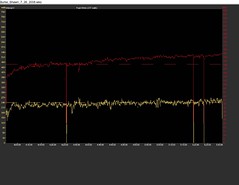
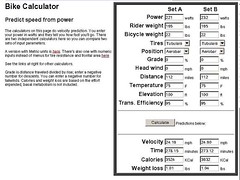
Last weekend I had a 90 minute effort at over IM pace and my average wattage was 232 and my Normalized power (what my body felt) was 234. My VI was 1.01 – pretty cheesy. My AP (Average power) is the power that was applied to the bike and using a spreadsheet we can calculate the speed and time it would take to go 112 miles if I held that power (which - by the way - I could not).

Interval steady:
Duration: 1:29:18 (1:30:49)
Work: 1244 kJ
TSS: 99.9 (intensity factor 0.819)
Norm Power: 234
VI: 1.01
Pw:HR: 2.86%
Pa:HR: n/a
Distance: 0 ft
Min Max Avg
Power: 0 298 232 watts
Heart Rate: 0 162 146 bpm
Cadence: 30 97 83 rpm
Speed: 0 0 0.0 mph
Pace 0:00 0:00 0:00 min/mi
Crank Torque: 0 381 237 lb-in
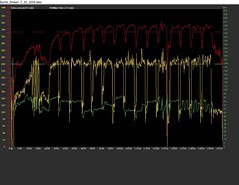
On Wednesday, I also had a 90 minute effort but this was done at 5 minute on and 1 minute off. The result was an average wattage of 221 but a Normalized power was 232 with a VI of 1.05. Basically these two rides were identical in the load on my body BUT the power to the bike was lower resulting in slower speed and I was 5% inefficient.

Interval 5 on / 1 off:
Duration: 1:29:04 (1:30:21)
Work: 1181 kJ
TSS: 98.2 (intensity factor 0.814)
Norm Power: 232
VI: 1.05
Pw:HR: 4.76%
Pa:HR: n/a
Distance: 0 ft
Min Max Avg
Power: 0 310 221 watts
Heart Rate: 0 169 141 bpm
Cadence: 29 104 76 rpm
Crank Torque: 0 491 248 lb-in
That lower power to the bike in the on/off style resulted in a total 5 minute slower ride than if I road steady but the cost on my body was the same – nothing gained – 5 minutes lost.

It is nearly impossible to ride really cheesy across a 5-6 hour effort without a power meter. Perceived exertion, HR and pace are all too variable to be reliable with varying winds, heat, fatigue and hydration.
But if you use a power meter and you get your Average power closer to your Normalized power, the lower your VI and the better your pacing – the more gas you could save for the run.
This does not mean riding easier – really – sometimes it actually feels harder but it will end you up where you want quicker and at a lower or equal energy cost.
So – listen to Snoop or Chamillionaire and ride “cheesy “not surgy and you will be in the hot tub before it’s full :)

No comments:
Post a Comment